Are you new to Wireshark Packet Captures?
I was there – I’ve received my first packet captures and was asked to analyze it.
Trust me! To have this skill – being able to tell where the problem is by reading a packet capture is a plus for you. Now and in the future!
After some time you get a feeling about first steps to do with Wireshark and how to give a first feedback.
1. Use a custom Wireshark Profile
When I was new to Wireshark and never analyzed packet captures before, i was lost.
I remember the time because packet analysis became an important role as “Site Reliability Engineer”. And I wasn’t ready.
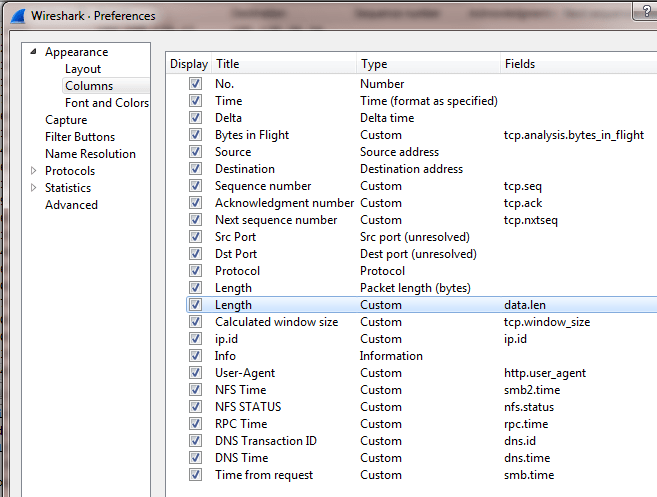
Wireshark opens your file with the “Default” profile which has the basic columns Packet Number, Time, Source, Destination, Protocol, Length, Info.
Over the time I understood that having more columns available from the beginning it will save time and helps also in troubleshooting.
As you can see in the screenshot, I’ve added several columns. Some of them are very important:
- Delta Time => It shows the delta time to the previous captured packet
- Bytes in Flight => Data which has been sent but not yet acknowledged
- Sequence Number
- Acknowledged Number
- Next Sequence Number
Adding those columns helped me to save time in analyzing!
2. Get first Information from the 3-Way-Handshake
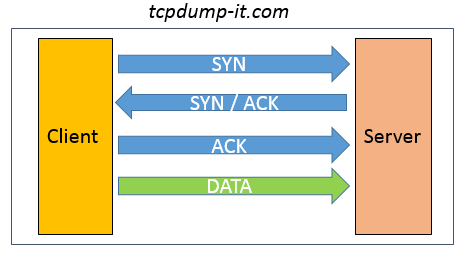
The 3-Way-Handshake is the most important step in TCP to establish a communication between client and server.
Here a short recap of how the handshake looks like:
- The Client sends a SYN packet with its Initial Sequence Number to the Server
- The Server acknowledge (ACK) the SYN packet (from the Client) and send its own SYN packet with its Initial Sequence Number
- The Client acknowledge (ACK) the SYN packet (from the Server)
- Now the TCP communication is established and able to exchange data
During the 3-Way-Handshake there is a lot of useful information exchanged between Client and Server.
Beside of Source IP, Destination IP, Source Port, Destination Port, Source MAC, Destination MAC you can also get:
- RTT = > Round Trip Time between Client and Server
- TTL => Time to live – With that value you can calculate the number of hops between Client and Server
- Calculated Window Size => The size of data which can be received before it needs to get acknowledged
With just 3 packets you can get an overview about your TCP communication.
Filter your packet captures to your destination address (for needed filters use my Introduction to Wireshark – Part 2) and start analyzing.
Starting from now I use as an example a TCP communication between my client in my private network and the tcpdump-it.com server (173.212.216.192).
3. Check how many packets have been lost
Since I am working on the infrastructure side my first goal is to understand if the network is behaving as it should be.
When I am asked to analyze a network packet capture, it is a mandatory step to understand the percentage of packet loss (TCP Retransmissions).
To do that I am using the display filter “ip.addr==173.212.216.192 and tcp.analysis.retransmission”. It shows all the packets which were retransmitted.
The next step is to open the “Capture File Properties” under the “Statistic” tab.
Under the Statistics section you can see the columns “Captured” and “Displayed”.
The “Displayed” column is based on your display filter and shows the statistics compared to the “Captured” data.
I used this example to show you an extreme case. You can see there are 10,4% packets retransmitted.
It depends on many factors how many percent of packet loss is critical. There are different opinions.
Probably no answer is correct, but when the packet loss is higher than 1% and is causing a high delay in the communication you should start checking better.
4. Open the Expert Information
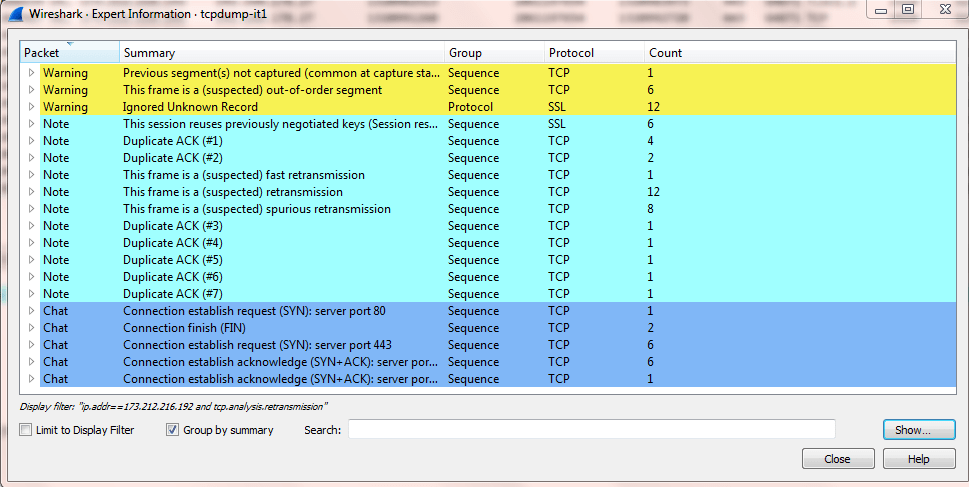
Wiresharks Expert Information is very useful and give you some idea of what to check in the packet capture.
In the Wireshark documentation you find following statement “Take expert infos as a hint what’s worth looking at, but not more”
This is exactly what you should do. When I first analyzed a packet capture, the Expert Information was very helpful and gave me hints in which direction to analyze.
Go to the “Expert” tab and select “Expert Information”. A new window will open:
In previous versions of Wireshark (v1) the overview about the “Warnings”, “Notes”, “Chats” were more clearer.
Get used to open the Expert Information. It will absolutely help you!
5. Open the Round Trip Time Graph
A short recap about what Round Trip Time means:
RTT means the time between a packet is send and an answer comes back.
For our packet captures analysis it is important to understand if there are packets with a high RTT.
That would mean that we suffer from a slow communication.
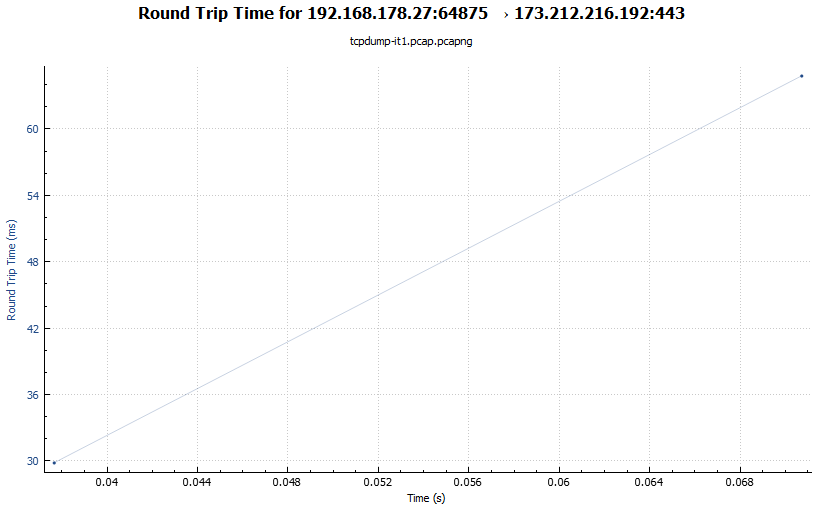
To open the Round Trip Time Graph go to “Statistics” >> “TCP Stream Graphs” >> “Round Trip Time”.
The graph shows on the Y-axis the RTT in ms while the X-axis show the time the packet capture was running in seconds.
This RTT graph in my screenshot is not significant but looks fine with a RTT of about 60 ms.
Look for spikes in the Y-axis to identify slow packets!
Summary
I want to repeat my sentence I wrote at the beginning of the post:
To have this skill – being able to tell where the problem is by reading a packet capture is a plus for you.
If you consider some parts of this post, you will be more successful in analyzing packet captures with Wireshark!
If you want to know more about it, join my Slack Workspace or send me an email.
Stay up-to-date and subscribe to my Newsletter!


nice very good news ,thanks
I have been searching for months for a “beginners language” in analyzing wireshark packets! Thank you so much for taking the time to explain everything and what the process should look like using common English…lol. I am not a professional, just a curious beginner that is learning on her own so I really do appreciate the breakdown..Take care
Thank you for taking the time to provide some insight on this. every little bit helps newbies like myself!