Welcome to my second part of “Introduction to Wireshark”
I am happy to see you back here.
In the first part we started to get a first overview about Wireshark and how to start capturing traffic.
Following article will show some of the most needed capture and display filter.
In addition I will show you some basic statistics to get a first overview about your tcpdump.
Time to read:
- 5 min
Target Group
- Beginner’s Level
Content
- Filter Syntax
- Statistics: Capture File Properties
- Statistics: Protocol Hierarchy & Conversations
Filter Syntax (Updated: 21.12.2017)
The table below shows the filters you need to set for your specific goals.
It is very cool to be able to use the “or / and” operators also in the filter section.
| Description | Capture Filter | Display Filter |
|---|---|---|
| Filter for 1 IP Address | host 173.212.216.192 | ip.addr==173.212.216.192 |
| Filter for more than 1 IP Address | host 173.212.216.192 or host 173.212.216.193 | ip.addr==173.212.216.192 or ip.addr==173.212.216.193 |
| Filter for 1 TCP Port | tcp port 443 | tcp.port==443 |
| Filter for 1 IP Address and 1 TCP Port | host 173.212.216.192 and tcp port 443 | ip.addr==173.212.216.192 and tcp.port==443 |
| Filter to show retransmissions | tcp.analysis.retransmission |
Statistics: Capture File Properties
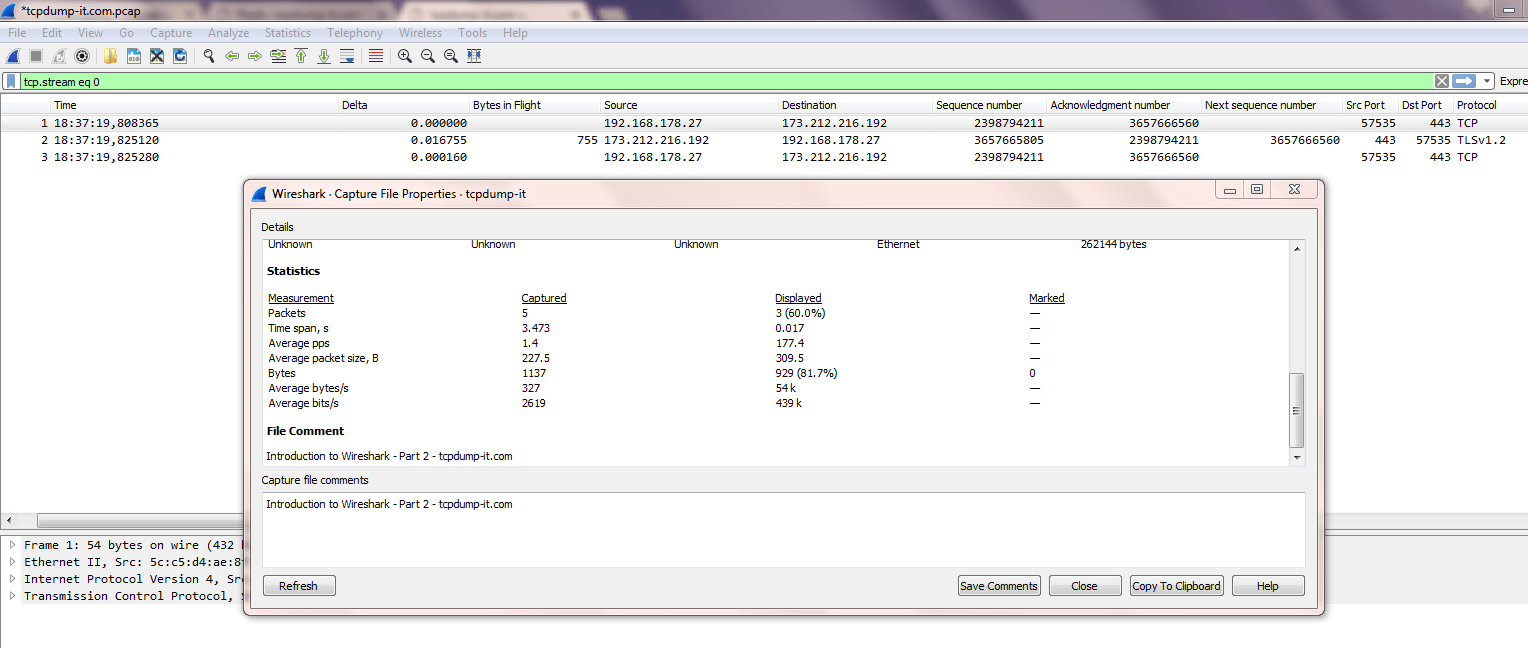
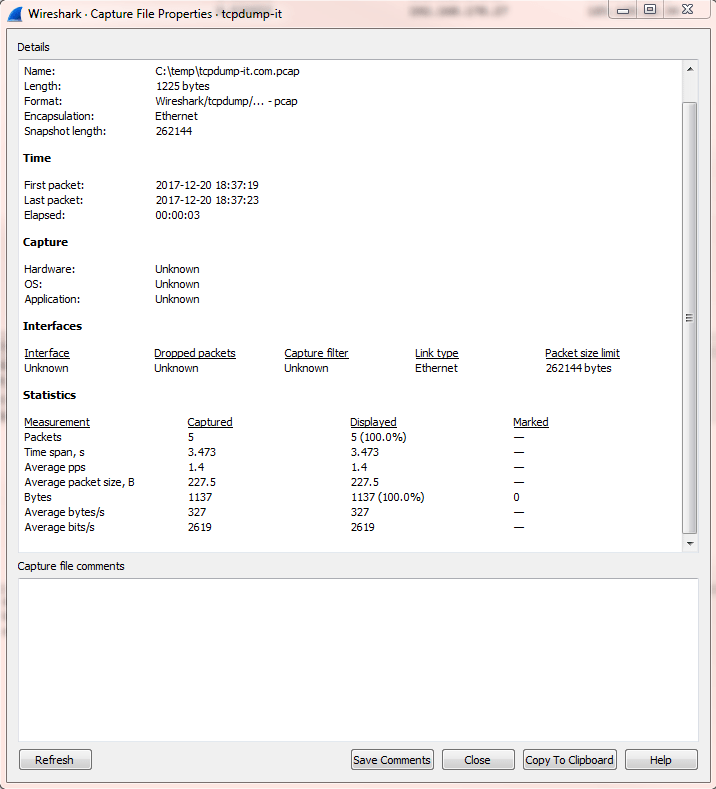
The first step I usually do when I open a tcpdump in Wireshark is to open the “Capture File Properties”.
It will show details like:
- Start + End Time of the Trace.
- Duration.
- Interface statistics.
- Statistics (Number of Packets, Average pps, Average packet size, Bytes, Average bytes/s, Average bits/s).
To open it click on the “Statistic” tab and select the first choice “Capture File Properties”.
Statistics: Protocol Hierarchy & Conversations
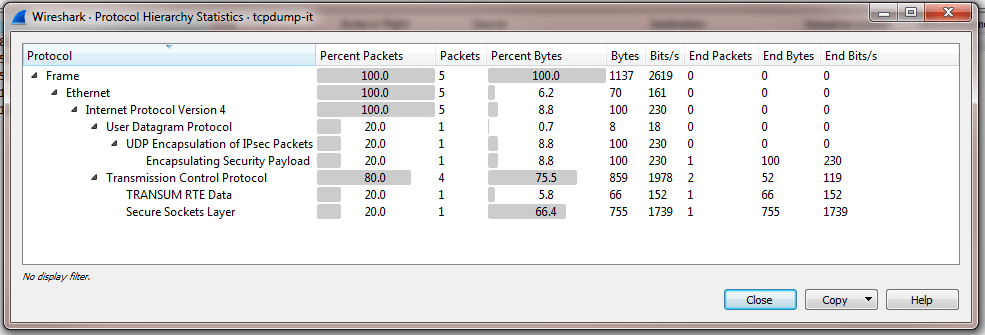
An important step is to get an overview about the captured protocols and TCP conversations.
The “Protocol Hierarchy” gives you a statistic which shows how many packets / bytes / bits are sent by Protocol.
To open it click on the “Statistic” tab and select “Protocol Hierarchy”.
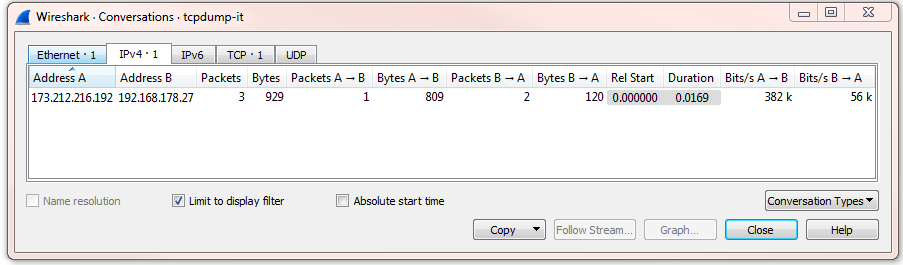
The “Conversations” statistic give you the same information by conversation for the “Ethernet, IPv4, IPv4, TCP, UDP” layer.
To open it click on the “Statistic” tab and select “Conversations”.
Summary
My feeling is that the topics covered in this article should give a first introduction to Wireshark filters and statistics. You can already see how powerful Wireshark is.
In my next articles I will cover more about the analysis of specific use cases.
If you want to know more about the Wireshark basics, join my Slack Workspace or send me an email.
Stay up-to-date and subscribe to my Newsletter!
3 thoughts on “Introduction to Wireshark – Part 2”