Starting from today, the new version 4.2.0 of the PCAP Analyzer for Splunk was uploaded. Beside several small fixes, the new version comes with a new dashboard which should help to analyze Wireshark traces – the “Problem Detection” dashboard.
What is it?
The new Dashboard has the following 7 panels:
-
Delta time (sec) by packet number : tcp-stream
This panel shows the maximum delta time by packet number (Top 10). It might be helpful if you look for delays in a communication! -
Max duration (sec) by tcp-stream
This panel shows the maximum duration of a tcp stream over time. It can be helpful to understand how long a tcp stream is alive!
-
Errors by tcp-stream
This panel shows the tcp errors by tcp-stream. It is helpful to see directly which stream could be the problematic one!
-
Unsuccessful 3-way-handshakes by conversation
This panel shows the 3-way-handshakes which did not finish successful, but shows retransmissions instead.
-
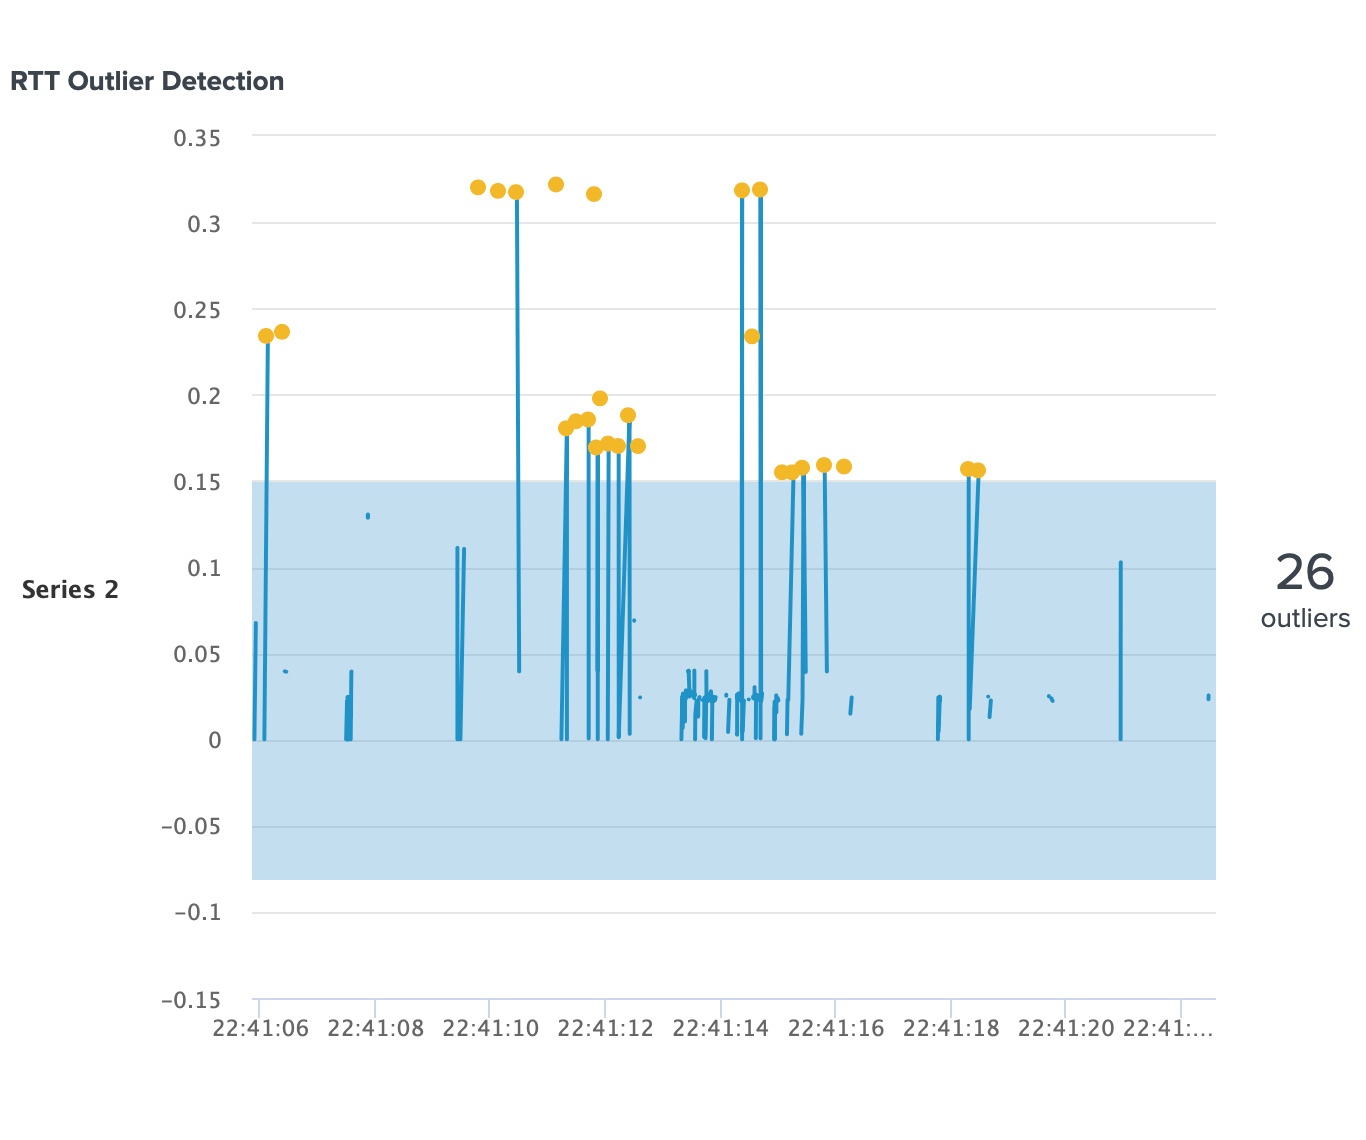
RTT Outlier Detection
This panel shows the outliers in relation to the RTT. It is helpful when you filter for a specific conversation! It requires Splunk Machine Learning Toolkit!
-
RTT Outlier Details
This panel shows the detailed outliers you see on the first panel.
-
Possible suspects
This panel is still a work in progress. This panel shows possible suspects where to put the focus in the Wireshark trace.
Example
I’ve created a short tcpdump on the server. It was automatically indexed to the Splunk app.
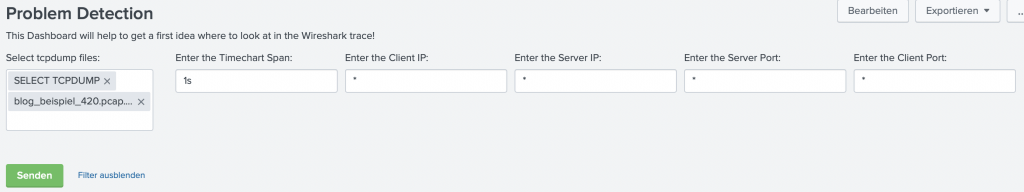
I will show you two examples of the Dashboard and how it works together with Wireshark.
After submitting your file to the Dashboard, the Delta time (sec) by packet number : tcp-stream panel shows me the following:
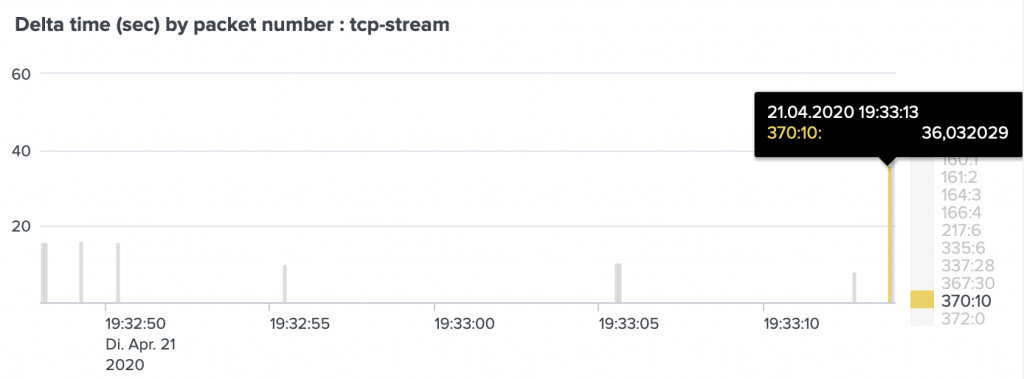
As you can see there is one packet with the number 370 which has a gap of 36 seconds to the last packet in the same stream (tcp.stream eq 10).
In Wireshark while opening the specific tcp stream we can see that exact packet which was shown to us in the dashboard. In this case we see that my server sent a retransmission with a delay of 36 seconds.
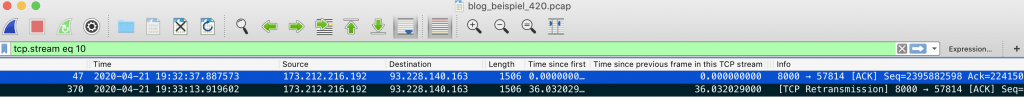
Even if that example is not very significant to see the power, with that use case in mind, this panel might point you to the right packet to look at.
The second example I want to show you is in case you want to know if a 3-way-handshake was OK or not. The problem detection dashboard includes the following panel:
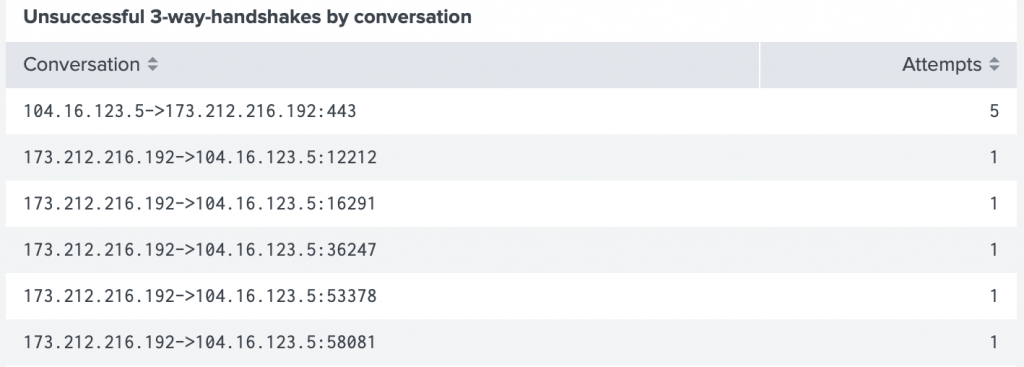
By checking the Wireshark trace for the second line in the panel, we can see that the PCAP Analyzer for Splunk did the job for you. I am using the Wireshark filter: ip.addr==104.16.123.5 and tcp.port==12212
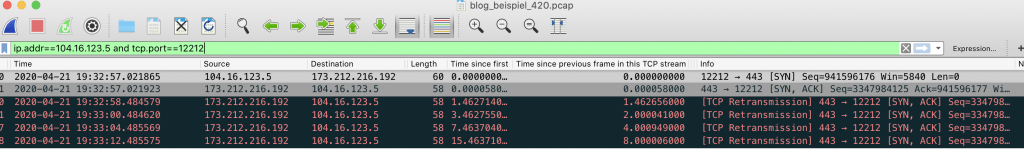
In this case the 3-way-handshake was not successful and the communication was not possible.
The dashboard is for those who are new in Wireshark and need some help in the analysis. With the help of the PCAP Analyzer for Splunk you get a first idea where to look at and where the problem might be.
Enjoy the new version and I am happy to revceive feedback.