Too many times we have situations we suffer from random network connection / latency problems which might be caused by a huge amount of traffic sent over the network or even a problem directly on the specific endpoints.
If you have such kind of problems, in the most of the cases it’s mandatory to capture network traffic on the affected endpoints or even better also on a network device in the middle.
The most popular tool to analyze network captures (.pcap files) is Wireshark.
There are many good tutorials in the Internet which shows good ways to understand and finding the root cause for such Incidents.
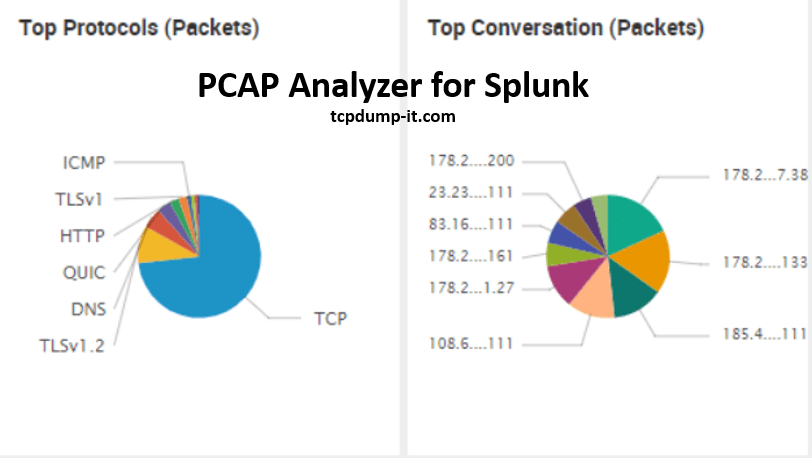
I am using Wireshark since more or less 4 years now and after that time and also after many network trace files I’ve looked in there are some features which are not included or hard to get out of Wireshark (e.g. Top Talker Conversations over time, Number of devices between the conversation endpoints).
So I started to think about a way to collect the network packet data by using Splunk. After several weeks checking which will be the best way I’ve decided to use the CSV functionality.
Wireshark includes several sub components including the tshark component which is able to convert the .pcap file to a Splunk readable CSV file.
I came up with the “PCAP Analyzer for Splunk” which can be downloaded from Splunk App page:
https://splunkbase.splunk.com/app/2748/
How to get started?
“PCAP Analyzer for Splunk” requires a full splunk instance running on *nix / Windows systems and Wireshark needs to be installed.
In summary the most important requirements are the following:
- Splunk instance with SPLUNK_HOME variable defined.
- Wireshark installed (on Windows: Wireshark needs to be located at %programfiles%)
- Confirm that your user has all administrative privileges for the folders “$SPLUNK_HOME/etc/apps/SplunkForPCAP/bin/” and for your Wireshark folder.
What’s next?
As soon as you have installed the “PCAP Analyzer for Splunk” on your Splunk instance the next step is to define a folder on your system which should be monitored for “*.pcap” files.
You can define this folder in the WebUI via Settings –> Data Inputs –> PCAP File Location.
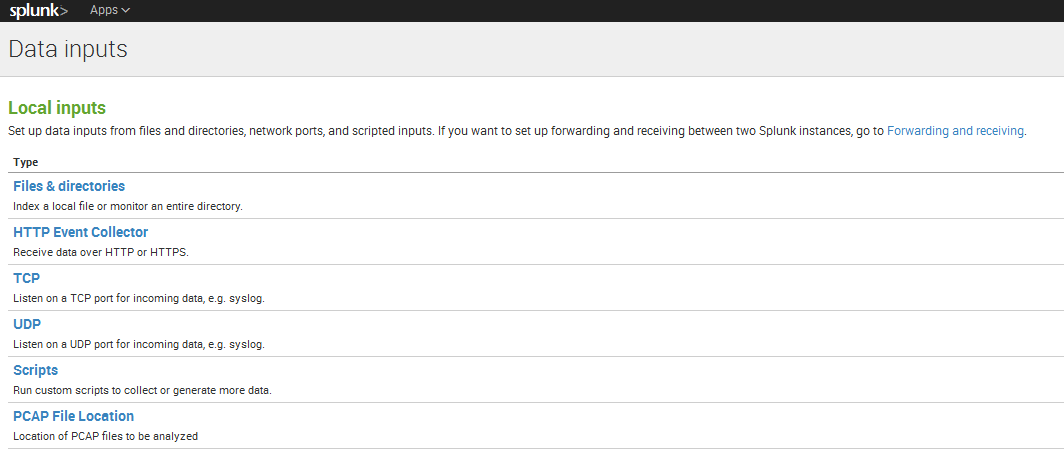
In this configuration panel you have to define a name and a path.
Lets make an example and use as name “myfolder” and as path “/var/tmp/”.
With this configuration a new folder will be created automatically at “$SPLUNK_HOME/etc/apps/SplunkForPCAP/”. It is the “local” folder which includes an “inputs.conf” file.
How to get my first “.pcap” file into Splunk?
If you can confirm that the above steps has been done successful, the next step is to put a “*.pcap” or “.pcapng” file in your folder you have defined (e.g. /var/tmp/).
Now the rest is done by the app.
“PCAP Analyzer for Splunk” checks every 5 minutes if a new pcap file has been added to your folder.
If it finds a new pcap file it will be converted and indexed automatically into Splunk.
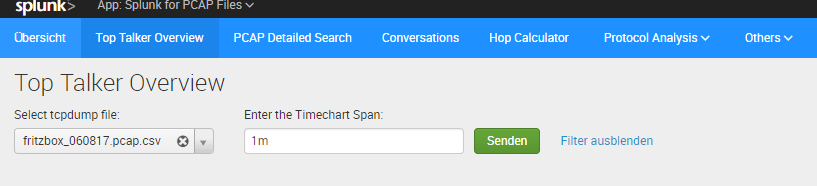
You can open a panel in the application and you should find your pcap file in the dropdown menu.
Good things to know!
- As soon as your “*.pcap” file is processed, it will be moved to the “converted” folder within your defined location. No need to worry 🙂
- Your files will be converted to an output file which are created in the folder “$SPLUNK_HOME/etc/apps/SplunkForPCAP/PCAP_Output”. You can delete those file after the indexing is done.
Field Names starting from Version 5.0.0
time_epoch
packet_number
time_delta
time_relative
protocol
highest_layer
length
source_ip
destination_ip
ttl
tcp_stream
tcp_source_port
tcp_destination_port
tcp_window_size
tcp_flags
tcp_syn_flag
tcp_ack_flag
tcp_push_flag
tcp_fin_flag
tcp_reset_flag
seq_number
ack_number
rtt
bytes_in_flight
retransmission
duplicate_ack
zero_window
window_full
reused_port
udp_stream
udp_source_port
udp_destination_port
dns_id
dns_query_type
dns_query_name
dns_id
dns_status
dns_response_name
dns_time
dns_response_ipv4
dns_response_ipv6
tls_record_layer
tls_content_type
tls_record_version
tls_record_length
http_request_method
http_request_uri
http_request_version
http_request_host
http_response_for_uri
http_response_status
http_request_in_packet
http_time
http_method
http_request_uri
http_request_version
http_host
http_response_for_uri
http_status
http_request_in_packet
source_mac
destination_mac
vlan_id
smb2_sessionid
smb2_messageid
smb2_cmd
smb2_sessionid
smb2_messageid
smb2_cmd
smb2_nt_status
smb2_time
rpc_xid
rpc_msgtyp
rpc_program
rpc_programversion
rpc_procedure
rpc_auth_machinename
rpc_auth_uid
rpc_auth_gid
rpc_xid
rpc_msgtyp
rpc_program
rpc_programversion
rpc_procedure
rpc_request_in_packet
rpc_time
nfs_status
mq_tsh_structid
mq_tsh_seglength
mq_tsh_convid
mq_tsh_requestid
mq_tsh_type
mq_tsh_ccsid
Summary
The tool helps me to understand details about each pcap file and you can even use it with the free version of Splunk on your workstation. When I receive a file to analyze, it will take 5 minutes to have the file converted into Splunk. Follow those steps and everything is set up properly.
I want to analyze static pcap file, How can i do that?
Hi, the app is quite cool.
if i may suggest setting the selection of the index to search into a macro for easy adaptation? Also the placementof the location for the converted pcap and the csv is a bit unfortunate if you tend to do a fair amount of pcap ingestion (i tried 500mb).
Also the selection of fields to be indexed would be cool if it were in the input definition. But also maybe it would be easier to just directly get the csv from stdout.
Thank you for your feedback! I am working on a new version at the moment.
Good Morning,
I am not an avid user of anything Apple. However, I find myself having to use a MacBook to analyze .pcap. I ran across your program which is amazing by the way, but am having a few issues.
As a windows user, I know that add ons need to be in the specific folder that the other program is running from. Example: World of Warcraft add-ons need to be in the WoW folder.
Does PCAPAnalyzerforSplunk need to be in the SPLUNK folder in order to work properly?
Daniel, thanks for creating this tool. It looks like it might be useful to me but I could not get it to work. I this error mentioned in Messages. “Unable to initialize modular input “pcap” defined in the app “SplunkForPCAP”: Introspecting scheme=pcap: script running failed (exited with code 1)..”
When I go to settings Data Inputs, I don’t see a data importer for PCAP.
And when I go to the App Dashboard examples, I see examples from the simple_xml_examples I installed.
Can you help me?
Daniel,
Great work! You’ve spent a lot of time on this and the dashboards look great. I’m using this to teach both Wireshark and Splunk to some students, but I’m also going to use this in production.
Well done, sir.
Thanks,
Hank
Hi
we have installed the SplunkForPCAP but sometimes i see that the files are converted into csv files but not pushed into Splunk Cloud, can I know what exactly check.
Hi Daniel,
Hope you are doing well
We have integrated pcap files with Splunk.
We would like to understand what is the sequence of files are getting converted into PCAPConverted location means which file first getting converted? We could see old files are still not getting converted.
We have total 50+ sites which we are receiving pcap files and we have created separate folder for each site(Same path given at Source end to identify site from source end). but we have given only below path with only one site name in PCAP File Location.
D:\Foldername_PCAP\SiteName folder
Hi Daniel,
Hope you are doing well
We have integrated pcap files with Splunk.
We would like to understand what is the sequence of files are getting converted into PCAPConverted location means which file first getting converted? We could see old files are still not getting converted.
We have total 82 sites which we are receiving pcap files and we have created separate folder for each site(Same path given at Source end to identify site from source end). but we have given only below path with only one site name in PCAP File Location.
D:\Foldername_PCAP\SiteName folder
In general the batch file behind on Windows should iterate through the files in alphabetical order.
If you see files not being converted there might be some reason behind – let me list some of them and maybe one of them fits your problem.
1 – The files are not in .pcap format – It is important to not use pcapng or any other format, as the script only checks for .pcap files.
2 – The folder in which the .pcap files are located are not properly set in “%SPLUNK_HOME%\etc\apps\SplunkForPCAP\local\inputs.conf. It might be necessary to re-add the folder location in the PCAP File Location on the Splunk UI.
3 – I have experienced that large .pcap files (>1/2 GB) are not converted in time (meaning, the conversion does not finish within 3 minutes). As a result, the script starts from the beginning and iterates again through your files. To solve this problem, you can increase the script runtime interval from 3 minutes to maybe 5 minutes. You can do it in the file /$SPLUNK_HOME\etc\apps\SplunkForPCAP\default\inputs.conf changing the value in seconds for the line interval = 180.0 in the bat script execution.
Hi,
everything seems to be in place ; the pcap file can be found in PCAPconverted and PCAPcsv. The input.conf file is also correct.
However, the file doesnt appear in Top Talker Overview.
Most of the cases with an empty csv file are related to variables not being set.
Since your files are already being moved to the right folder, I assume it might be related to the variable TSHARK which is used by the script or the correct file permissions are missing for the Splunk app folder.
One option as a first step would be to open your Splunk UI and do the following search: “index=_internal *pcap2csv*”
Can you check if you see any errors using that search?
Hi,
we have installed the analyzer, and we have tshark on the machine(centos). It seems , all is installed as described, and yet I do not seem to see any of our .pcaps converted. PCAP file location is configured and is seen in the .conf file.
What are we missing?
I recommend to set the SPLUNK_HOME path also in splunk-launch.conf inside your $SPLUNK_HOME/etc/.
The user assigned to the Splunk process needs to execute scripts inside “$SPLUNK_HOME/etc/apps/SplunkForPCAP/bin/” which points to the wireshark installation.
So make sure that the folders has the right access rights to be able to write to “$SPLUNK_HOME/etc/apps/SplunkForPCAP/ and to execute scripts inside /bin.
Hi Daniel,
Thanks for the app – I followed the instructions and able to ingest the PCAP data – And I see the PCAP files been moved to $SPLUNK_HOME/etc/apps/SplunkForPCAP/PCAPcsv – But in the app the dashboards are not returning any values. And also when I Check the size of csv files in $SPLUNK_HOME/etc/apps/SplunkForPCAP/PCAPcsv they are of 0kB. is it normal?
Thanks
Ravi Dudala
Most of the cases with an empty csv file are related to variables not being set.
Since your files are already being moved to the right folder, I assume it might be related to the variable TSHARK which is used by the script or the correct file permissions are missing for the Splunk app folder.
One option as a first step would be to open your Splunk UI and do the following search: “index=_internal *pcap2csv*”
Can you check if you see any errors using that search?
Hi Daniel,
Having some issues setting this up.
– I’ve set the SPLUNK_HOME variable using bash (https://dev.splunk.com/enterprise/tutorials/quickstart_old/setsplunkhome/) and also modifying the splunk launch file (https://community.splunk.com/t5/Splunk-Enterprise/How-do-i-set-the-SPLUNK-HOME-location-within-splunk/m-p/178362). Set both to /opt/splunk/
– SplunkForPCAP and /bin/ have full permissions (used chmod 777 to be absolutely sure).
– Wireshark is installed, event used tshark to collect a test pcap.
– Added the data sources in the Splunk web GUI (even did several variations to ensure I wans’t missing a ~ or /).
– Splunk Stream is installed.
App is still saying “Awaiting user confirmation” in overview. Not sure if I missed a simple start button or something move complex. Any thoughts? Thanks.
Hi Jesse,
I would first check if your data is collected properly with the search: index=* sourcetype=pcap:csv
If you see data with a search over all time, we are sure that the configuration is ok.
In the Dashboard of the Analyzer app, you need to add the pcap file you want to see to the list and click on the search button.
Feel free to contact me on my email and we will figure it out together.
Thank you,
Daniel